There are endless amounts of indicators you can use to start trading the Gold market. However, what you will often find is the best indicators are the simplest and the ones that give you the cleanest trade ideas.
What you will also find is that as you start to add more and more indicators to your chart they will start to contradict each other. This can often lead to analysis paralysis where you simply don’t know what to do.
The three best indicators you can use to trade Gold are;
- The Average True Range
- Moving Averages
- Fibonacci Tool
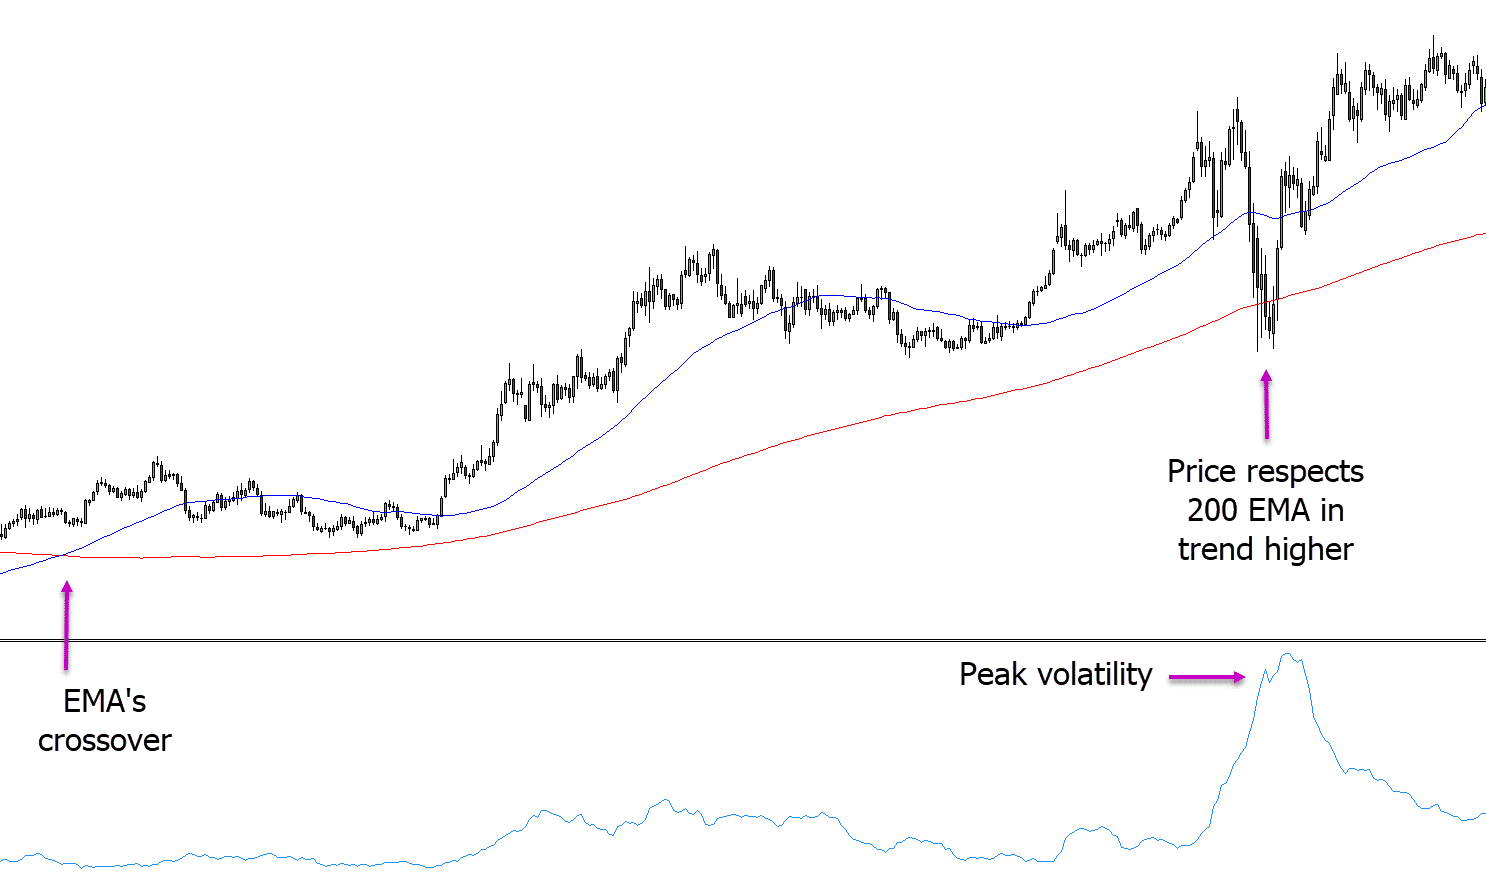
We discuss the Fibonacci tool below and how you can use it on smaller time frames, but in the example below we have added both moving averages and the average true range to the chart.
The average true range is showing us when volatility is picking up and when price is making bigger moves.
The two moving averages are showing us what trend price is making and we are also using them for dynamic support and resistance.
When we see the 50 period exponential moving average cross above the slower moving 200 period exponential moving average we know that price is looking to trend higher.
With this information we can start to look for long trades. In this example we notice that the ATR has started to spike with large volatility and price is respecting the 200 period EMA indicating a potential trade to go long.
Leave a Reply