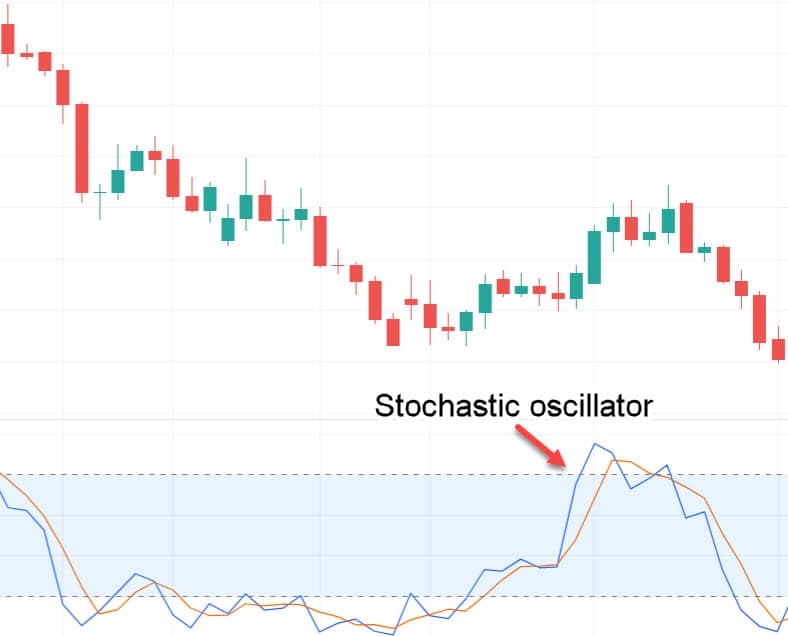
Two popular indicators for making counter trend trades are the stochastic oscillator indicator and the relative strength index (RSI).
These indicators can help you find when the price is overbought or oversold and when the price could soon be making a correction.
The RSI is a straightforward indicator that oscillates between 0 and 100.
Price the reading moves above the 70 level; it indicates the price is overbought. This could also signal that the price is looking to make a reversal back lower.
On the flip side, when the price moves below the 30 level, it indicates the price is oversold. This could be hinting at price making a reversal and moving back higher.
Lastly
Counter trend trading strategies can be as straightforward or as complicated as you like.
Some of the best strategies will combine several things, such as popular indicators and price action analysis.
The easiest way to perfect these strategies is to download some free demo charts and make practice trades. That way, you can test with different markets and different time frames.
Leave a Reply