Let’s practice what we learned in the above paragraphs with few of trigonometry functions graphing questions.
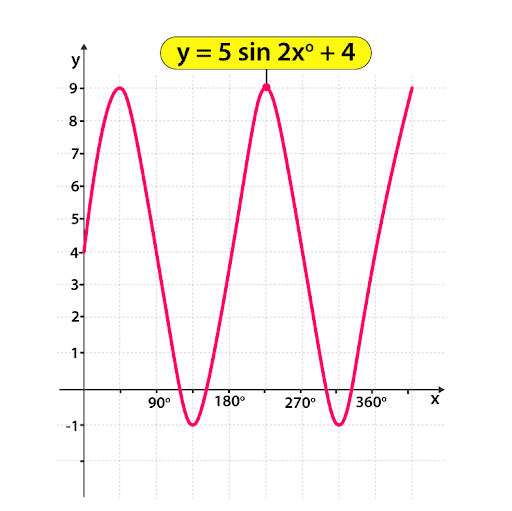
1) Sketch the graph of y = 5 sin 2x° + 4
- Amplitude = 5, so the distance between the max and min value is 10.
- Number of waves = 2 (Each wave has a period of 360° ÷ 2 = 180°)
- moved up by 4
- max turning point when (5 × 1)+ 4 = 9 and min turning point when (5 × -1) + 4 = -1
- Period = 2π/2 = π
- The graph looks like:
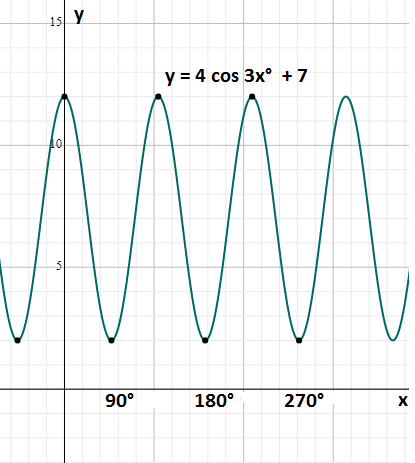
2) Sketch the graph of y = 4 cos 3x° + 7
- Amplitude = 4, so the distance between the max and min value is 8.
- Number of waves = 2 (Each wave has a period of 360° ÷ 2 = 180°)
- the vertical shift is 7
- max turning point when (4 × 1)+ 7 = 11 and min turning point when (4 × -1) + 7 = 3
- Period = 2π/3
- The graph looks like:
Leave a Reply