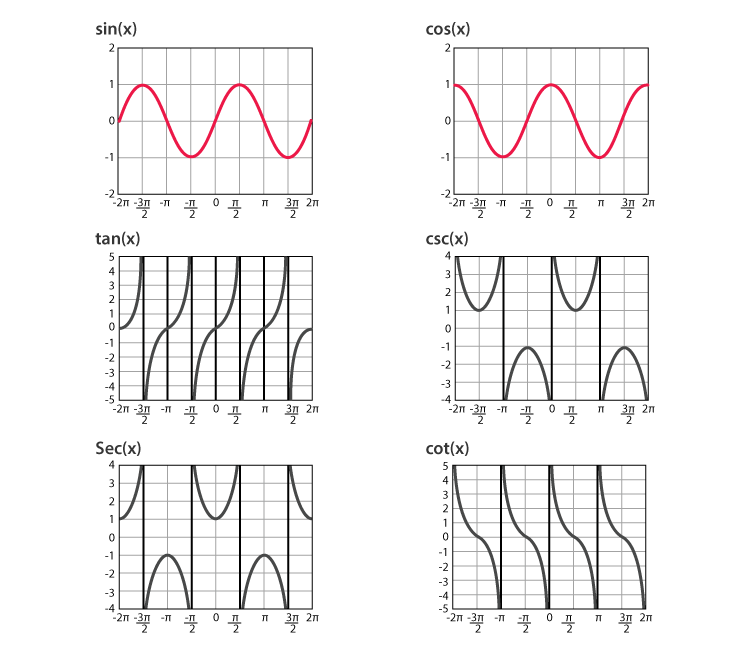
The six trigonometric functions are:
- Sine
- Cosine
- Tangent
- Cosecant
- Secant
- Cotangent
Trigonometric graphs for these Trigonometry functions can be drawn if you know the following:
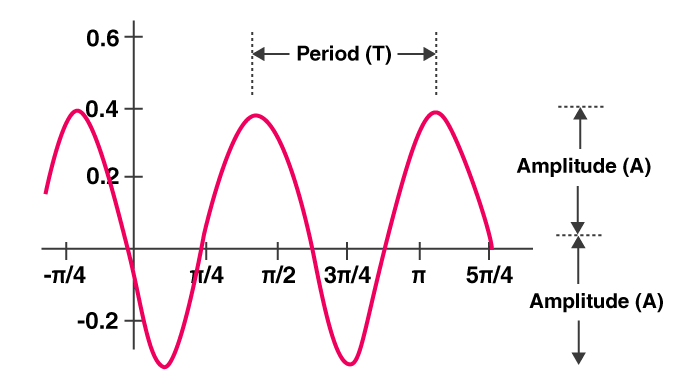
Amplitude
- It is the absolute value of any number multiplied with it on the trigonometric function.
- The height from the centre line to the peak (or trough) is called amplitude.
- You can also measure the height from highest to lowest points and then dividing it by 2.
- It basically tells how tall or short the curve is.
- Also, notice that the function is in usual orientation or upside down depending on the minus or plus sign of the amplitude value.
Period
The Period goes from any point (one peak) to the next matching point.
The graphical representation of period and amplitude of a function is given below.
Phase
How far the function is shifted from the usual position horizontally is called a Phase.
- Max and min turning points.
How to Draw the Graph of a Trigonometric Function?
Different methods can be used to draw the graph of a trigonometric function. The detailed explanation of one of the efficient methods is given below.
While drawing a graph of the sine function, convert the given function to the general form as a sin (bx – c) + d in order to find the different parameters such as amplitude, phase shift, vertical shift and period.
Where,
|a| = Amplitude
2π/|b| = Period
c/b = Phase shift
d = Vertical shift
Similarly, for the cosine function we can use the formula a cos (bx – c) + d.
Thus, the graphs of all the six trigonometric functions are as shown in the below figure.
Leave a Reply